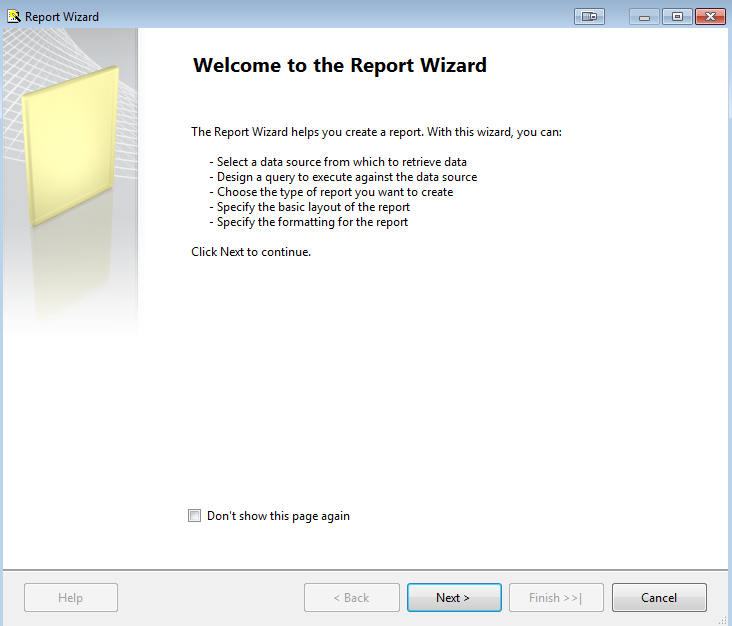
Create a chart
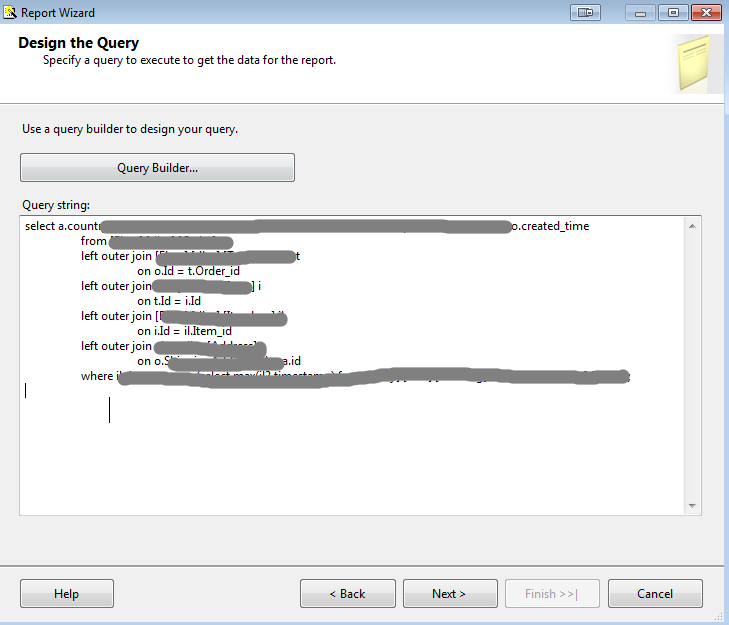
Prepare query
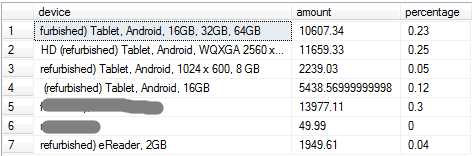
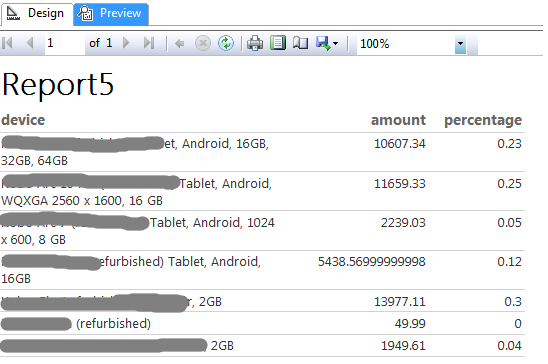
select
	i.title as device,
	sum(t.quantity_purchased * transaction_price_value) as amount,
	round(sum(t.quantity_purchased * transaction_price_value) / sum(sum(t.quantity_purchased * transaction_price_value)) over(), 2) as percentage
from ...
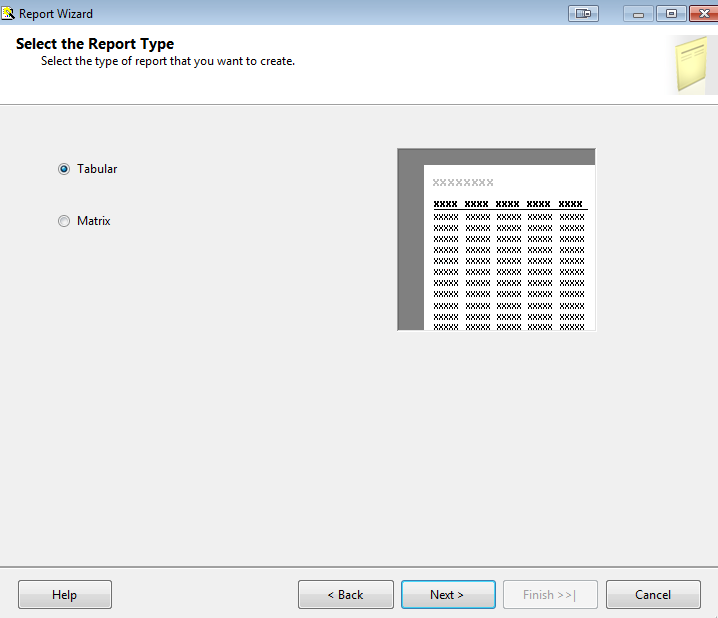
Create table
right click project > add report
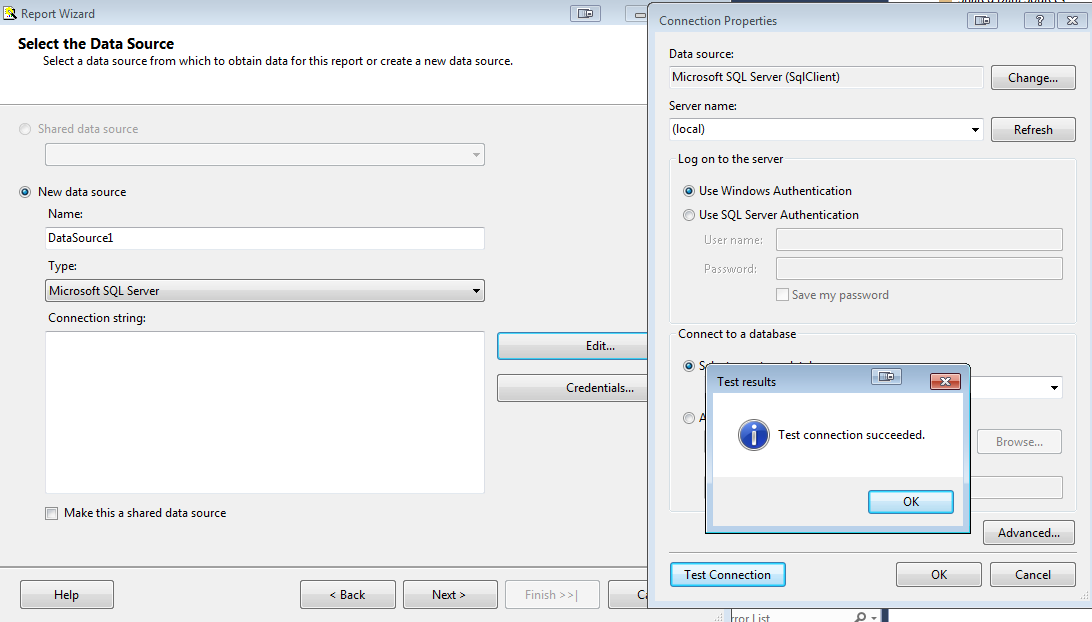
Create a new data source or use a shared one
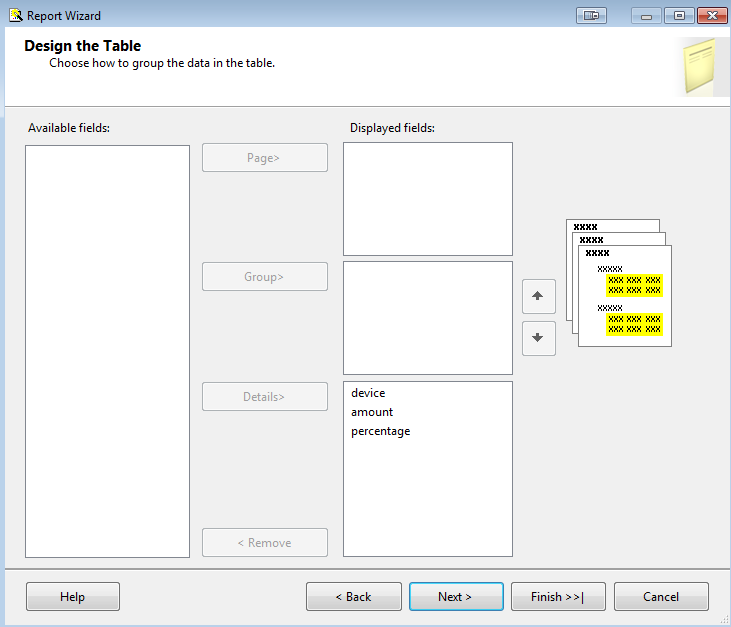
select fields
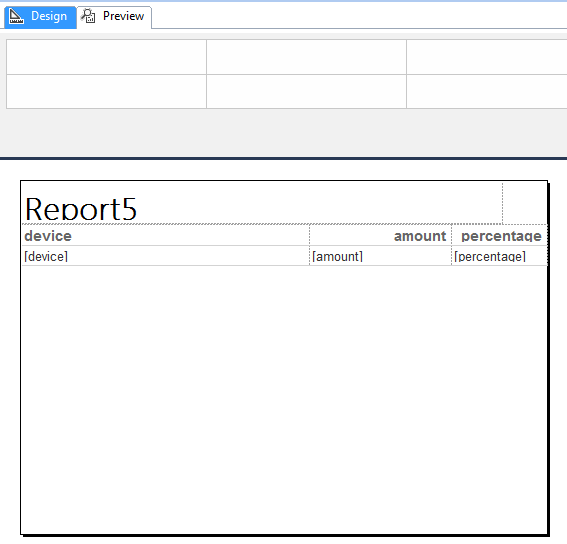
Save and preview
Create chart
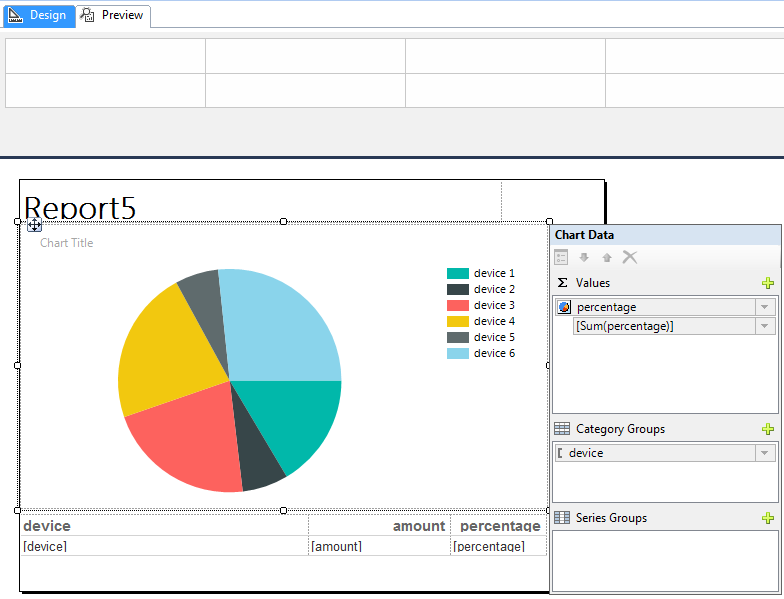
switch to design view, expand area
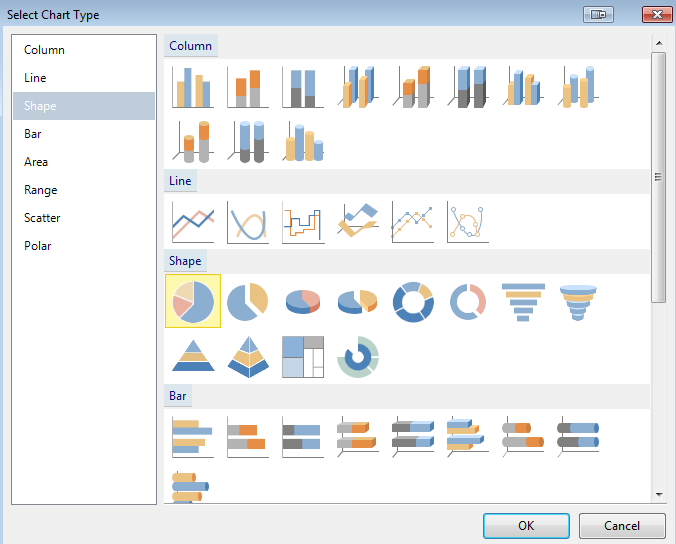
right click > insert chart > piechart
right click > set value
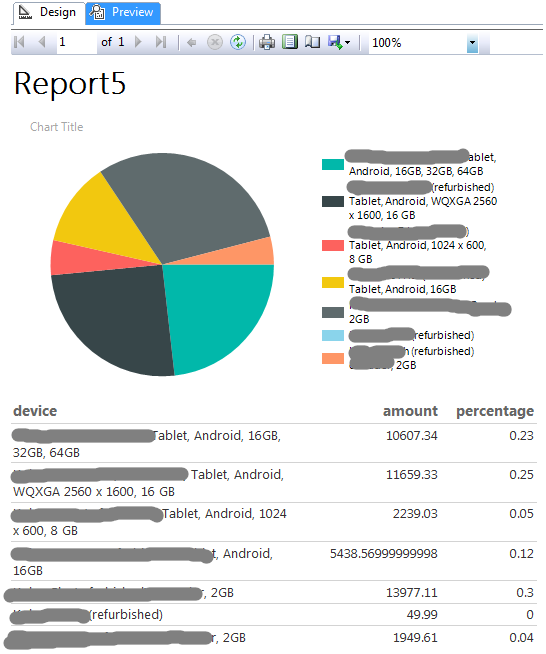
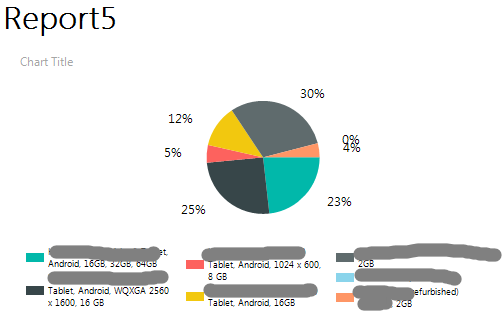
preview the chart
Create drillthrough report
prepare child chart
check tutorial 3 > Create drillthrough report > Create a child report with parameter
Link chart with child report
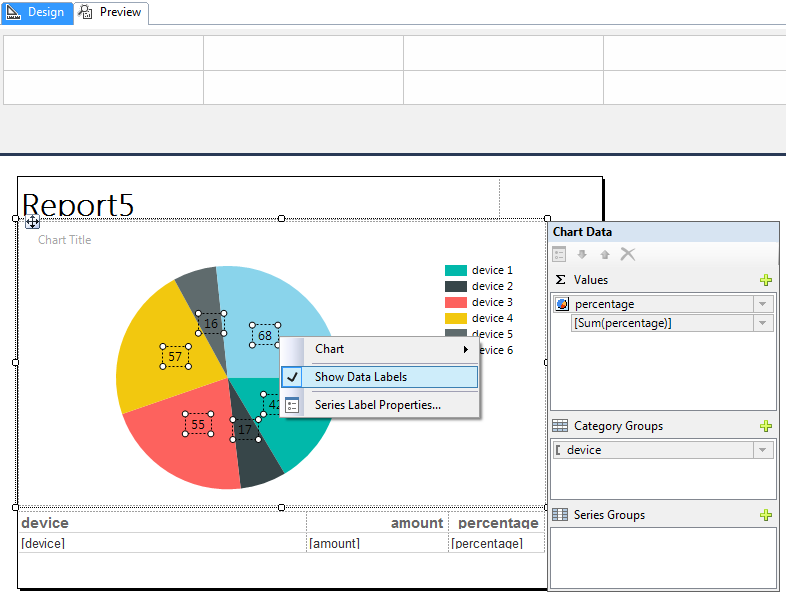
switch to design view > right click the chart > show data labels
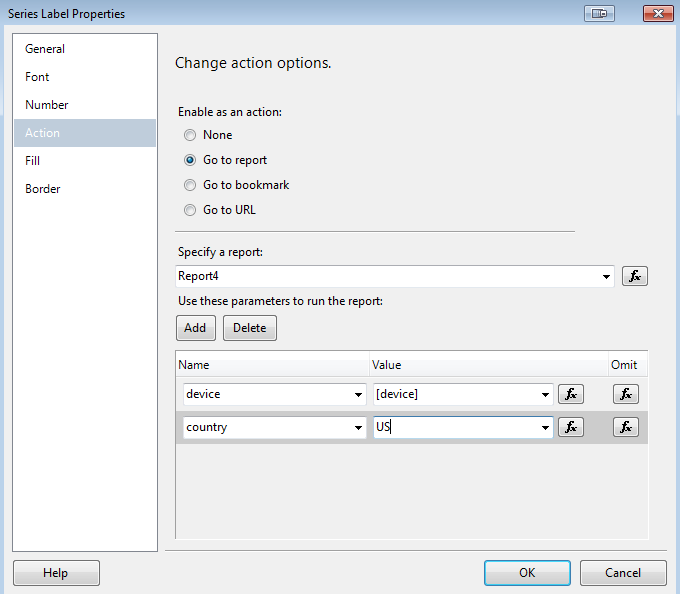
right click the chart > series label properties > action > go to report > specify child report > add parameters
swith to preview
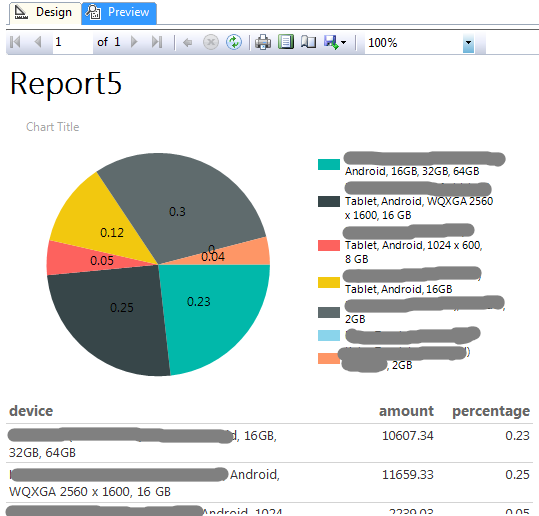
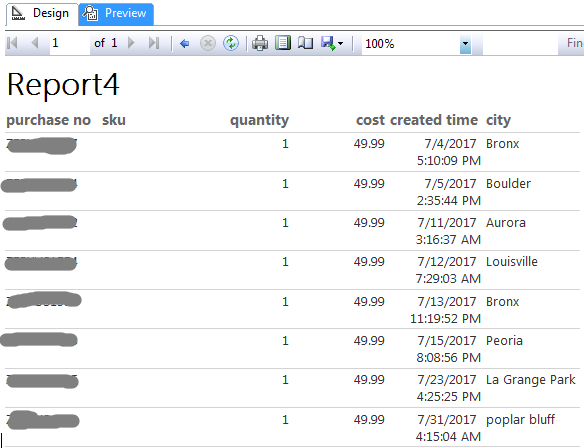
click the label and navigate to child report
Customize chart
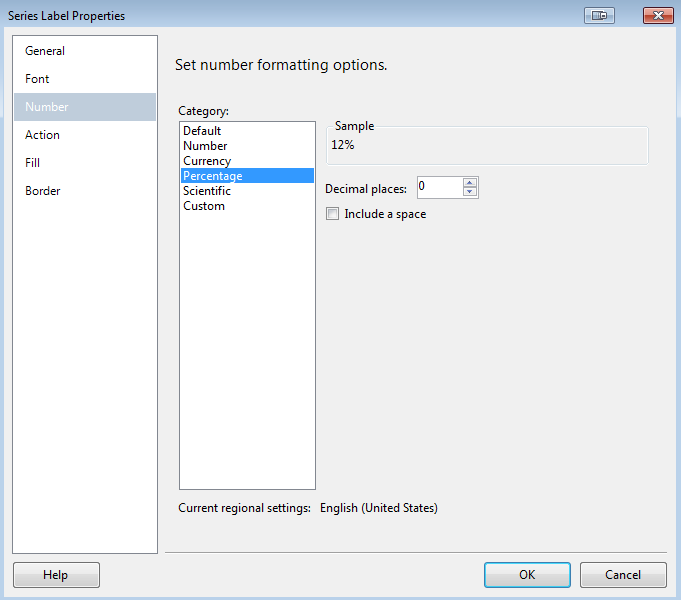
right click label > properties > number
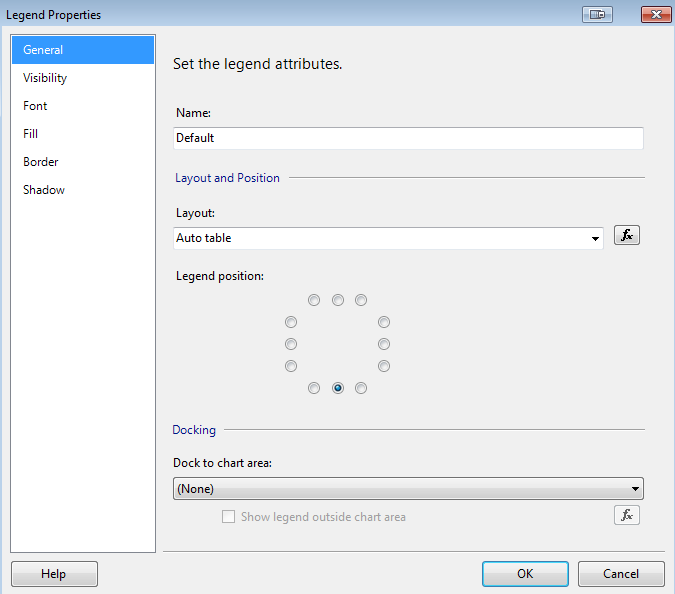
right click legent > properties
preview chart
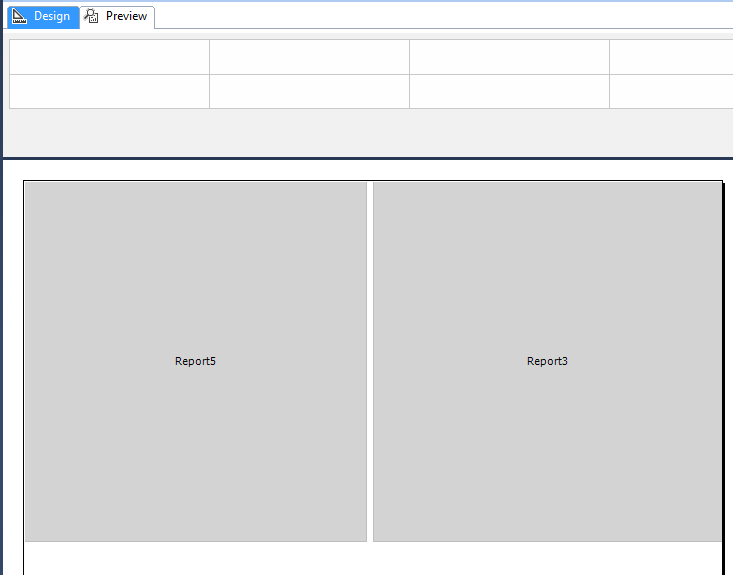
Display multiple reports in a page
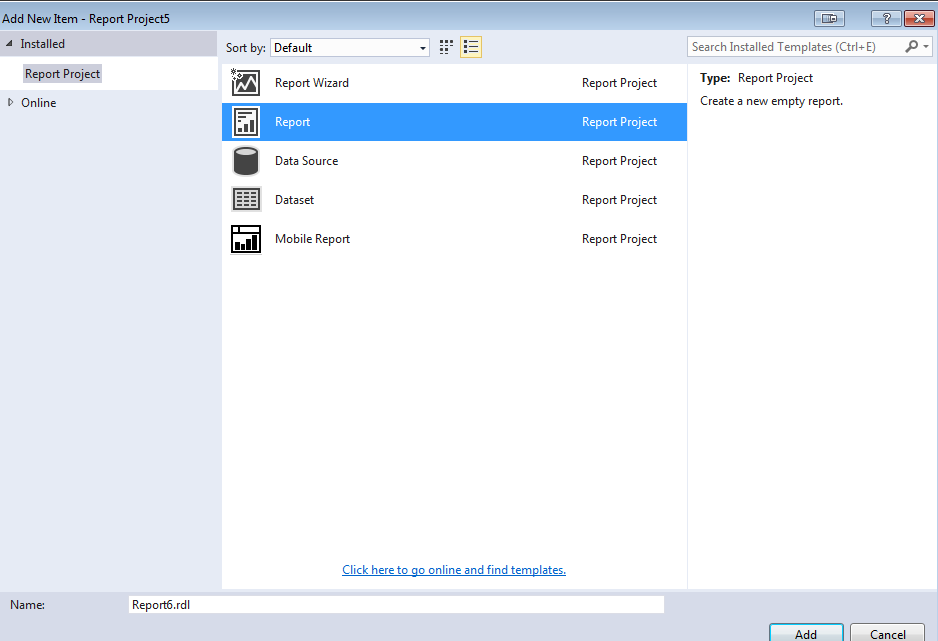
right click project > add item > report, add a blank report
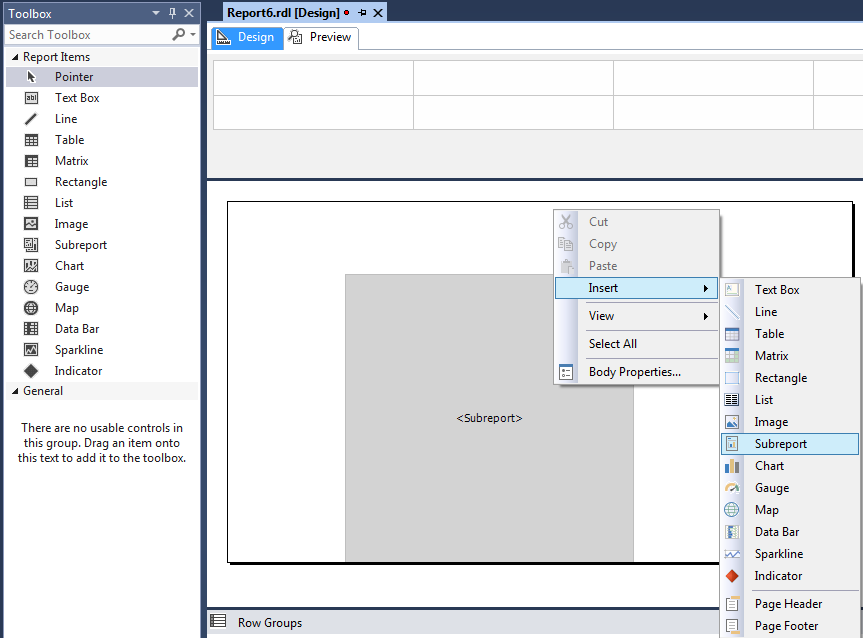
add subreports via toolbox or right click > insert
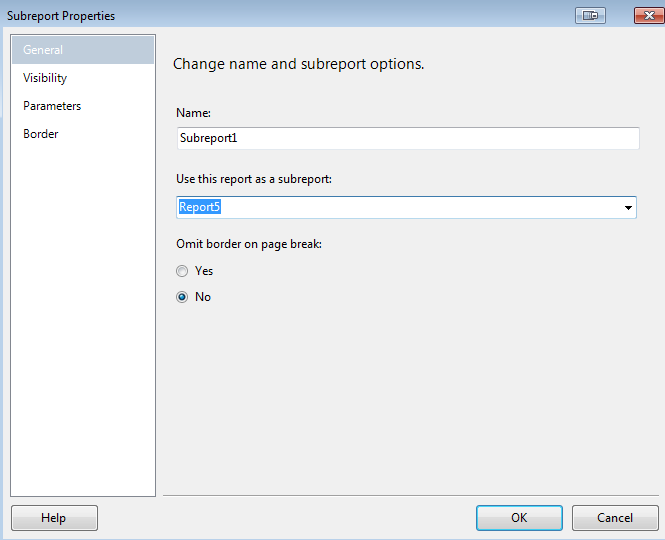
right click subreport > properties > select a report
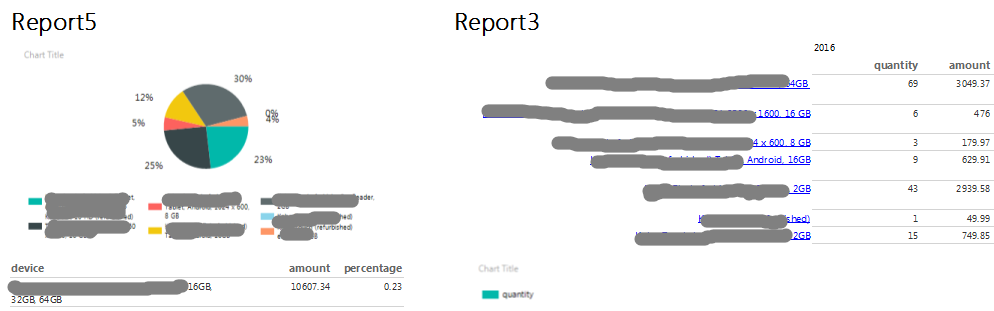
save and preview
or
-
Previous
SQL Server Reporting Services Tutorial 3 - Create more reports -
Next
SQL Server Reporting Services Tutorial 5 - Integrate reports in web page