Create a dropdown report
Let’s create a dropdown report including date, order_no, amount, quantity. We can drill down the date via year/quarter/month/day and view special orders
Prepare sql query
- create query
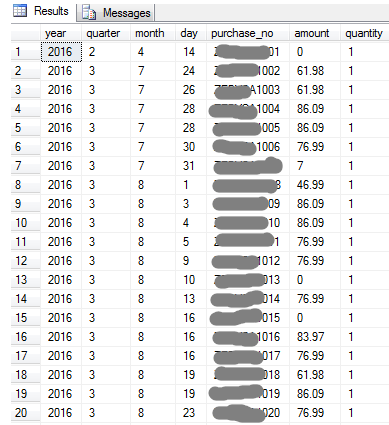
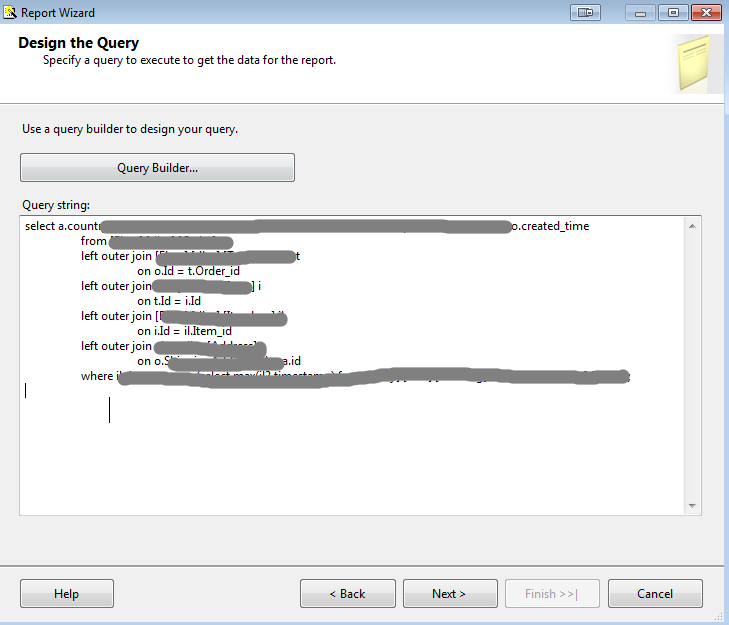
select
	year(o.created_time) as year,
	datepart(quarter, o.created_time) as quarter,
	month(o.created_time) as month,
	day(o.created_time) as day,
	o.purchase_no,
	o.amount_paid_value as amount,
	t.quantity_purchased as quantity
	from ...
- try it
Create dropdown chart
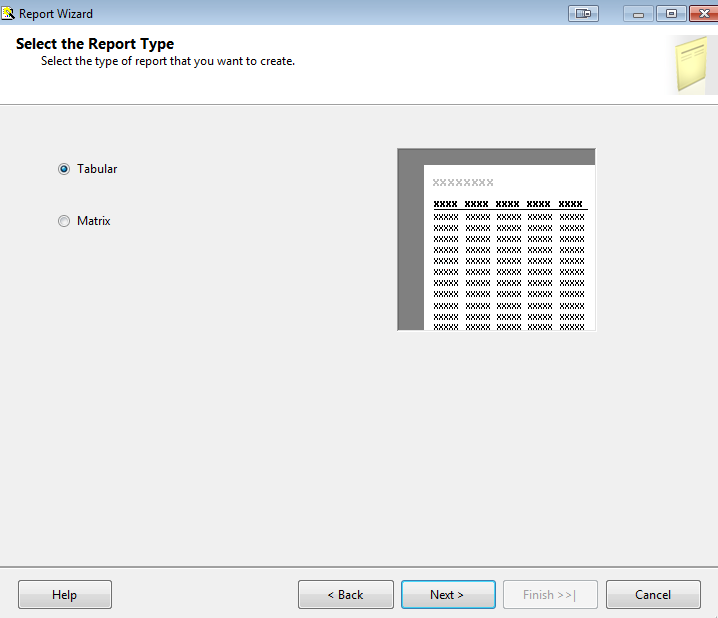
open visual studio > create a brand new report project or add a new report
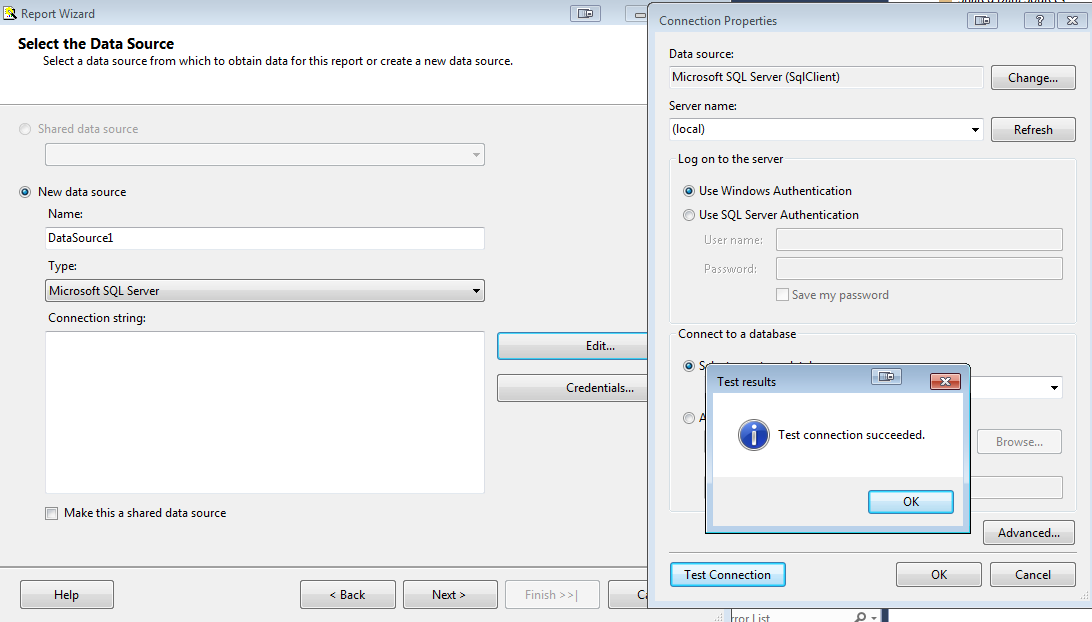
Create a new data source or use a shared one
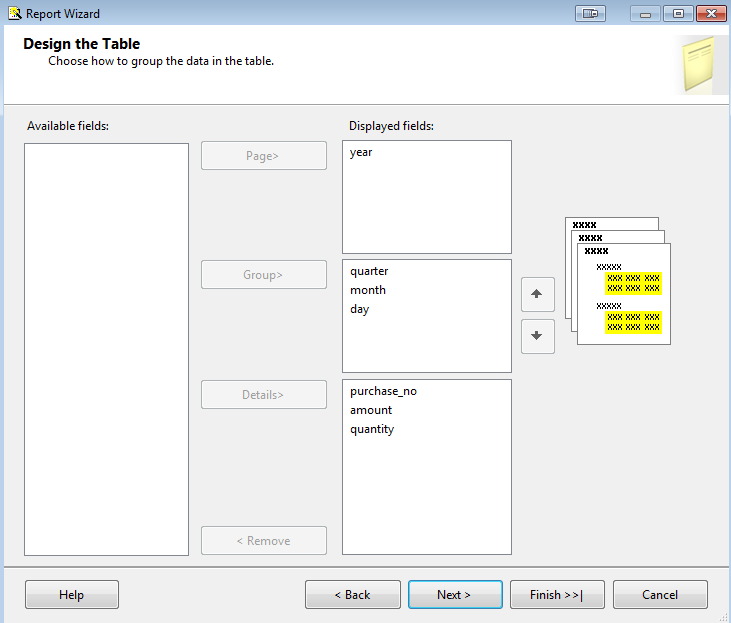
Here, we want the report has year as the header, then drill down through quarter/month/day, finally has purchase_no, amount, quantity as the details.
Enable subtotals and drilldown
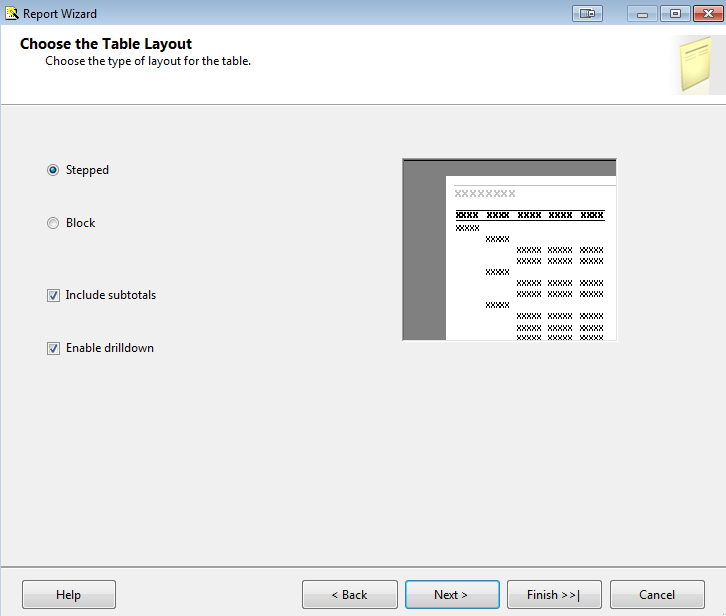
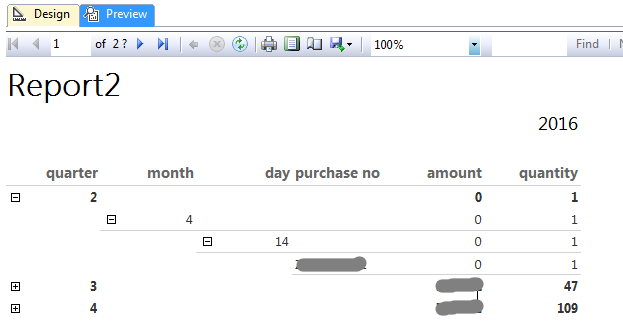
Next and create the report, here is the design view
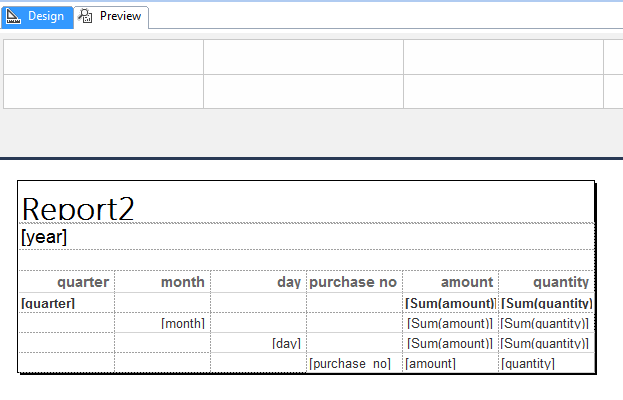
Switch to preview mode and preview
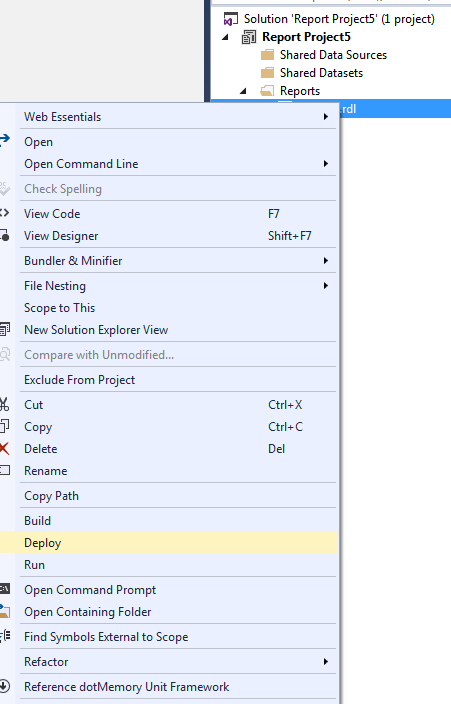
deploy the chart
solution exploer > right click the report > deploy
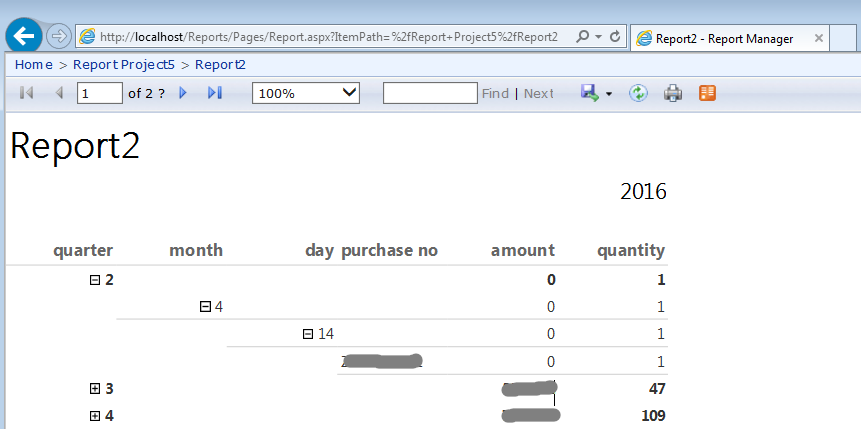
Open browser > navigate to http://localhost/Reports > click the report
Create a matrix report
Let’s create a new report which has year as the header, then drill down through quarter/month/day, finally has purchase_no, amount, quantity as the details.
- prepare query
select
i.title as device,
a.country_code,
year(o.created_time) as year,
sum(t.quantity_purchased) as  quantity,
sum(t.transaction_price_value) as amount
from ...
-
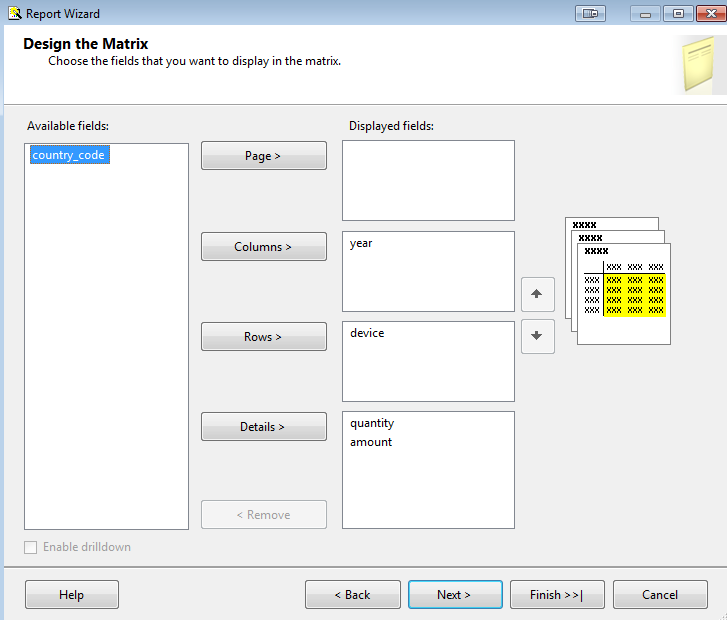
create query and please select metrix option in the wizard
-
Please select the column and row separately, here we leave country_code as a parameter
-
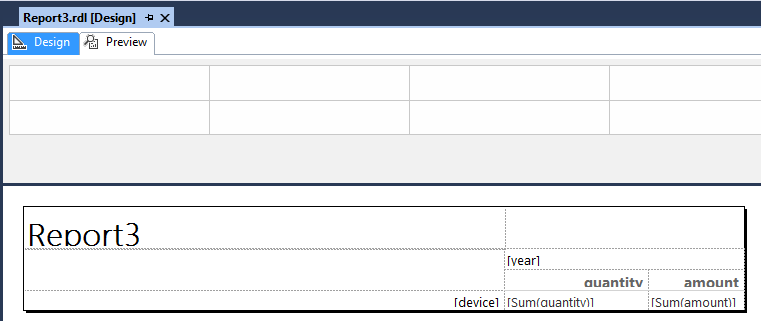
save the report, here is the design view
-
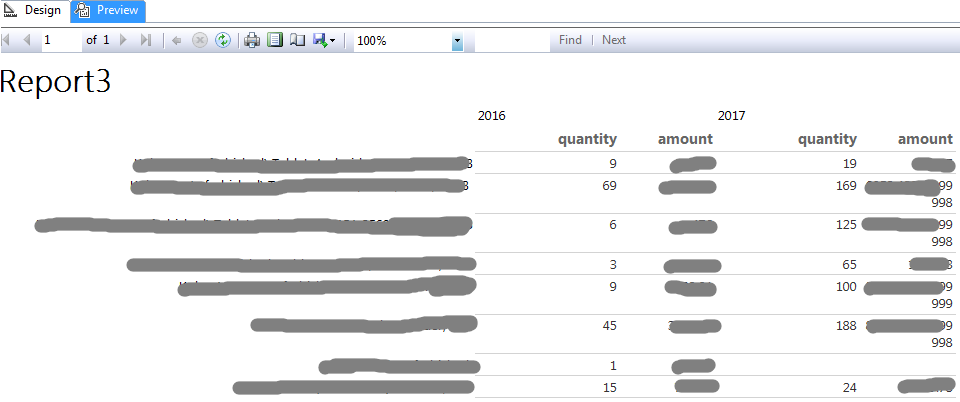
swith to preview mode
-
right click the report to deploy and display it in the report website
Customize matrix report
Format
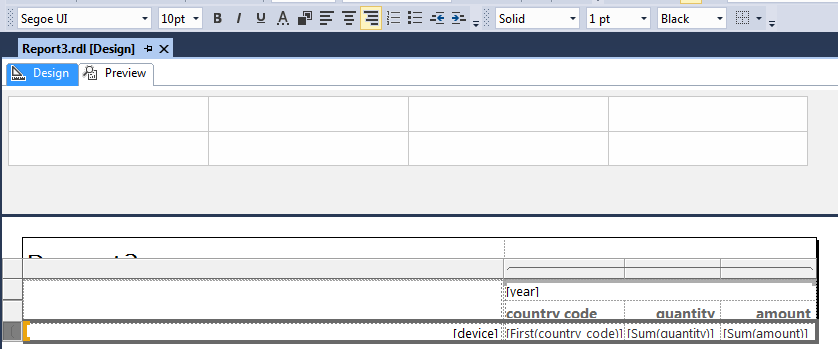
- switch to design view, select the row we want to format, use the upper toolbar to adjust the font/alignment/…
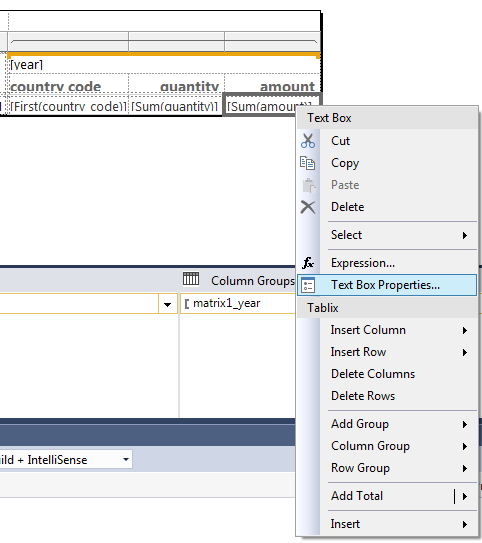
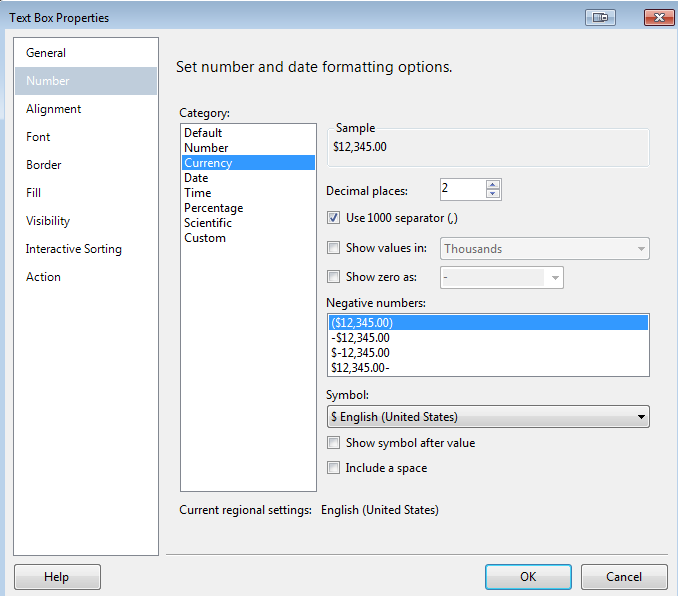
- right click the cell we want to format > textbox properties > number > change to currency
Add parameter
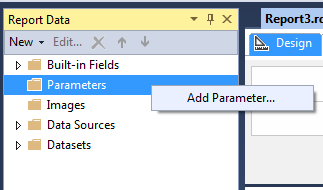
- add a new parameter
report data pane > parameters > right click to add a new parameter
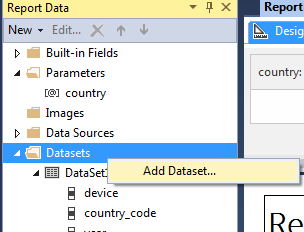
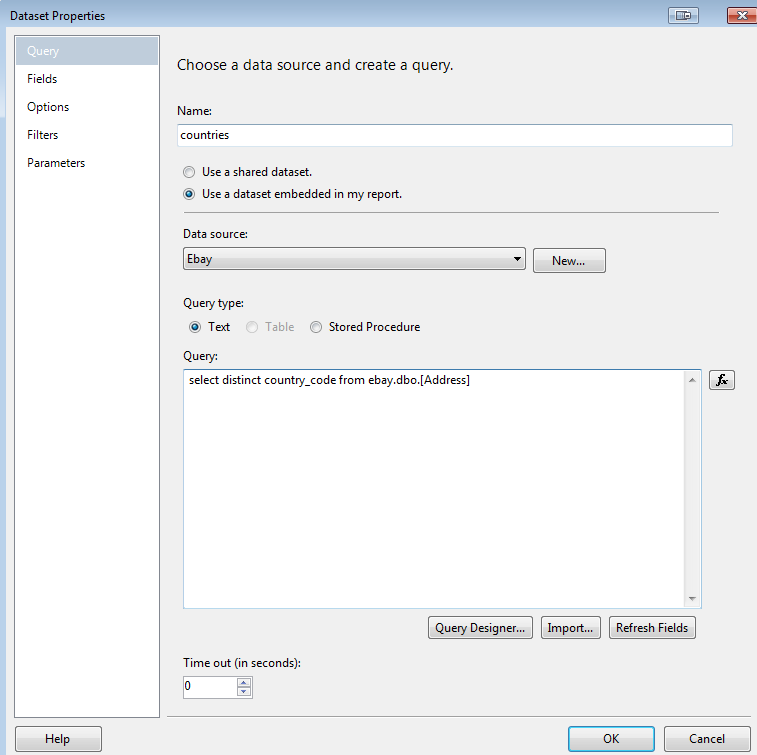
- add new dataset as the source of parameter dropdown selector
report data pane > dataset > right click to add
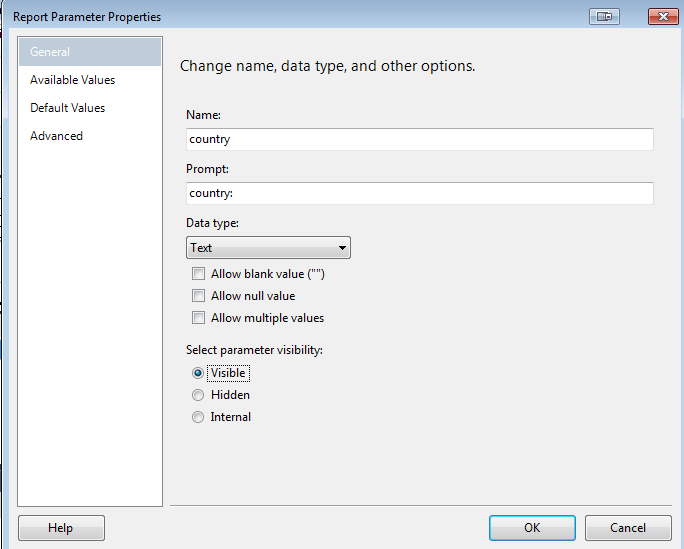
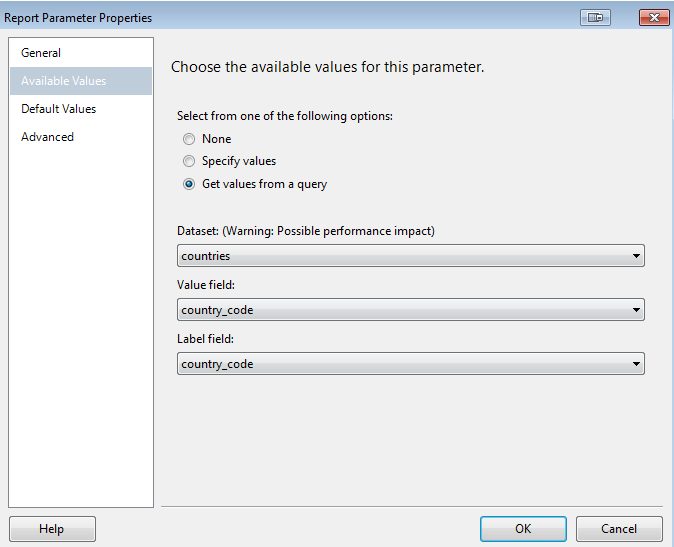
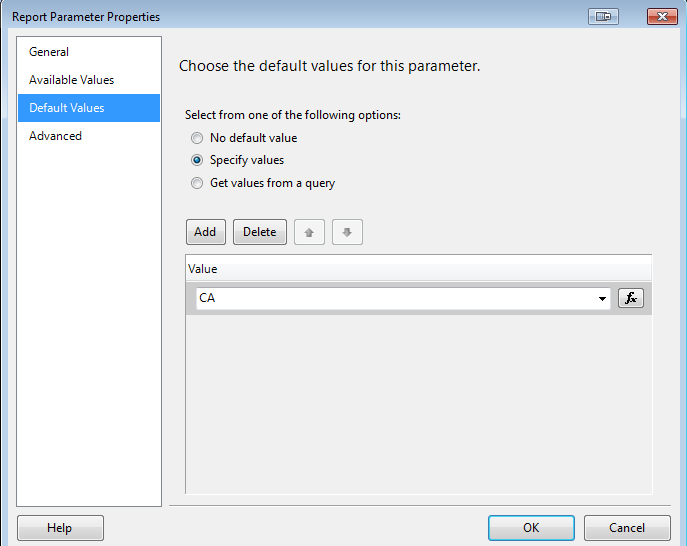
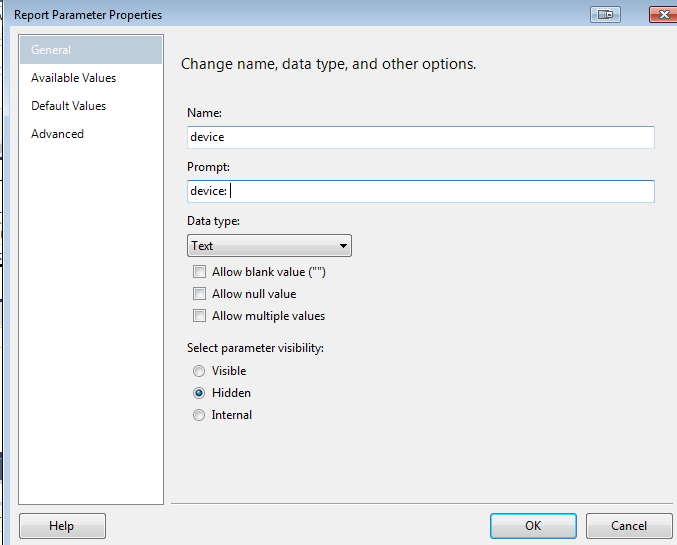
- double click the new paramter to edit properties
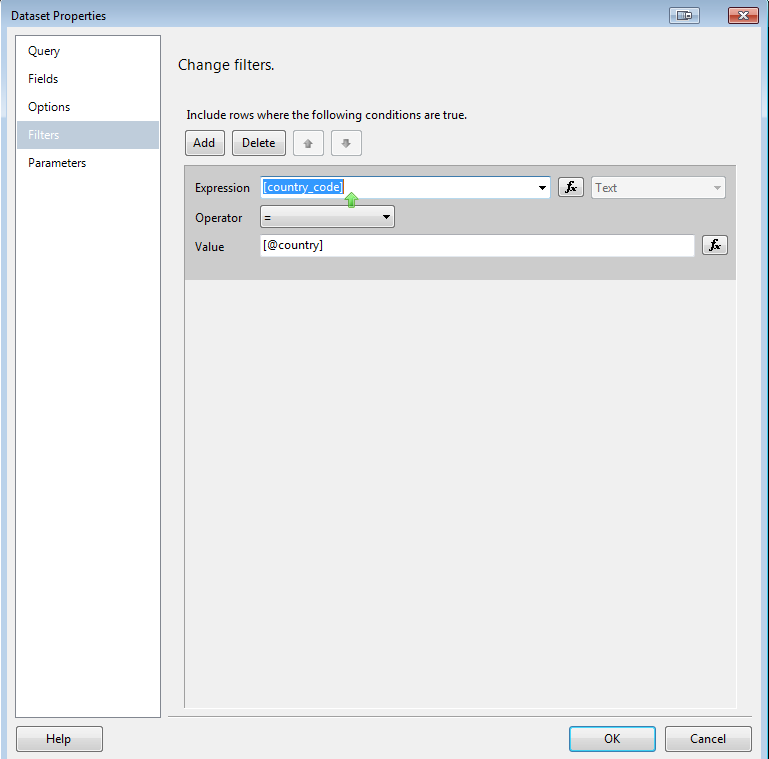
- double click the previous dataset to use the new added parameter as the filter
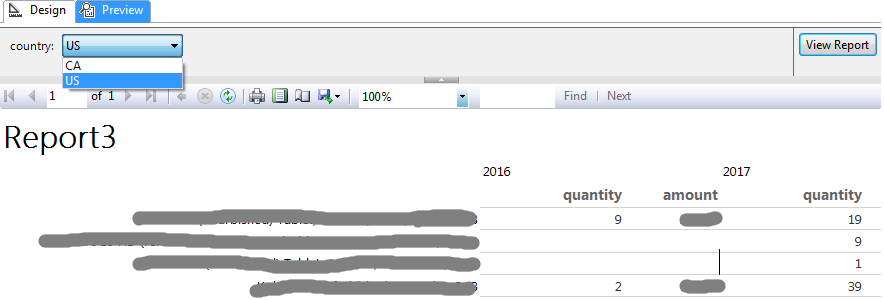
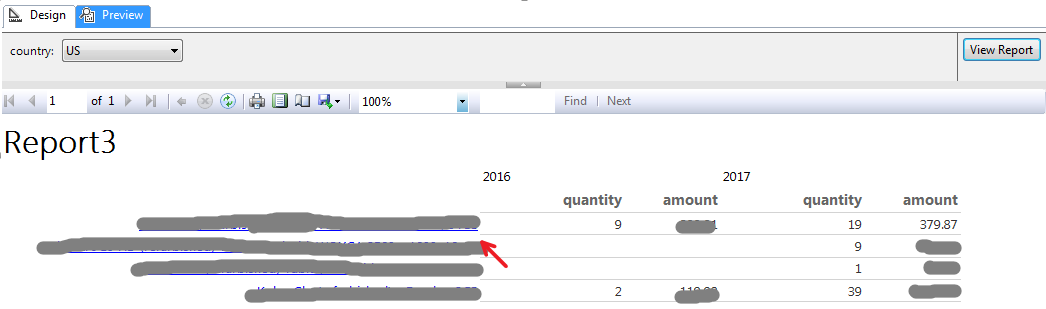
- switch to preview mode, now the interactive selector works! select the country and click the View Report button to get different reports
Create drillthrough report
Create a child report with parameter
- Prepare query
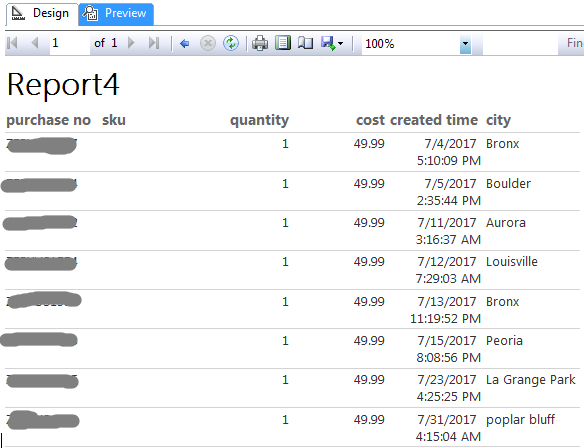
select
o.kobo_purchase_order_no as purchase_no
, i.title as device
, v.sku
, t.quantity_purchased as quantity
, t.transaction_price_value as cost
, o.created_time
, a.country_code as country
, a.city_name as city
from ... >
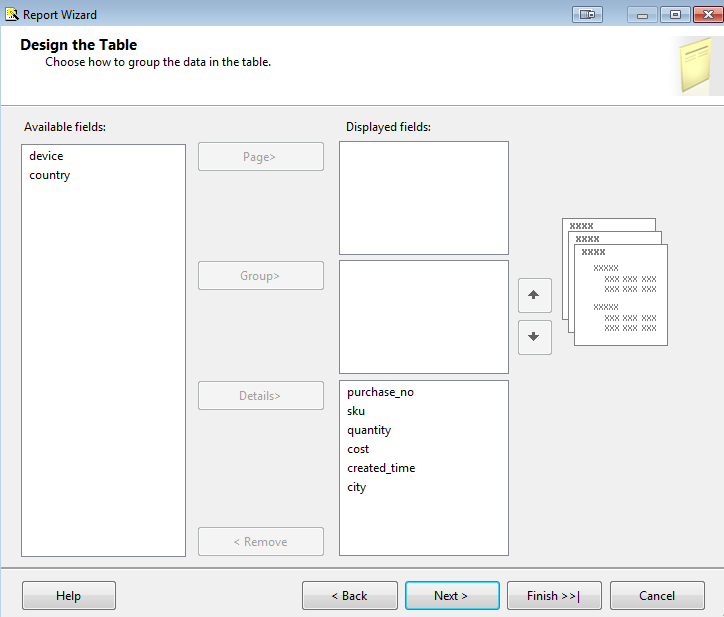
- create a new report by wizard > tabular > leave device, country as parameters > finish to save the report
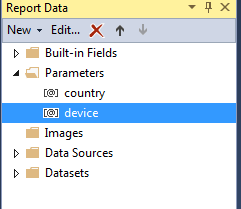
Create parameters
-
create two parameters, hide these parameters
-
open the dataset properties > modify query
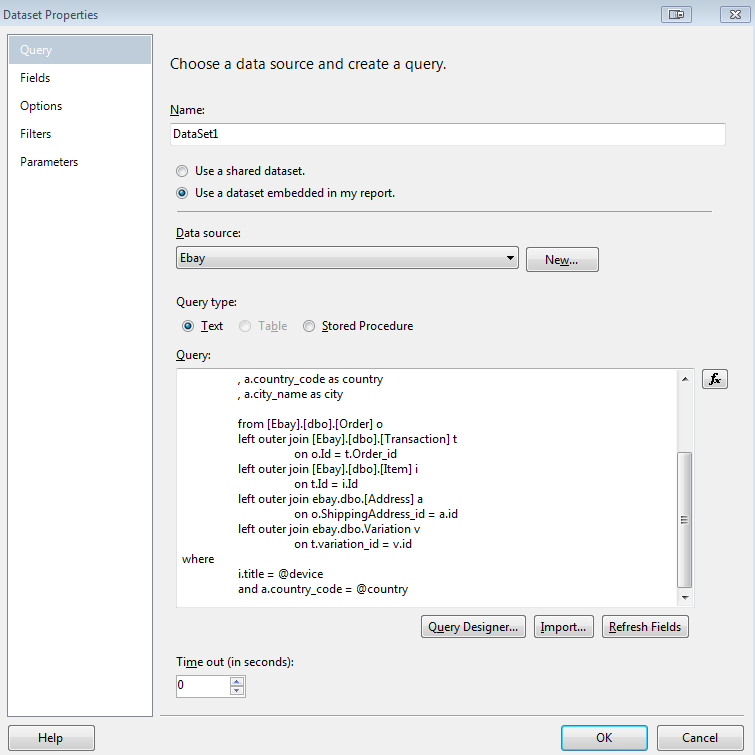
 ...
 where
     i.title = @device
     and a.country_code = @country
Link parent report with child report
-
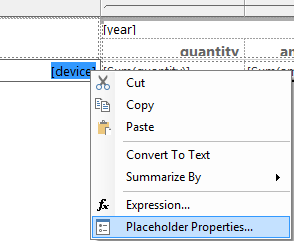
switch to parent report > right click device > textbox properties
-
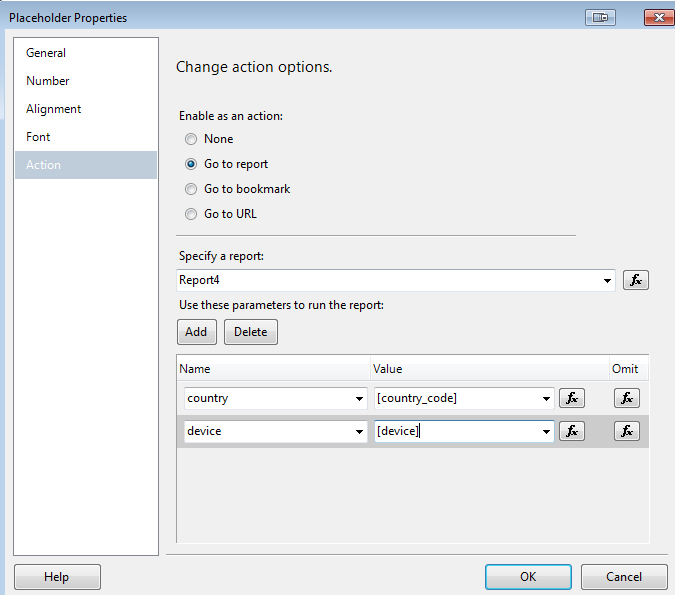
switch to action tab > goto report > specify the child report > add two parameters
-
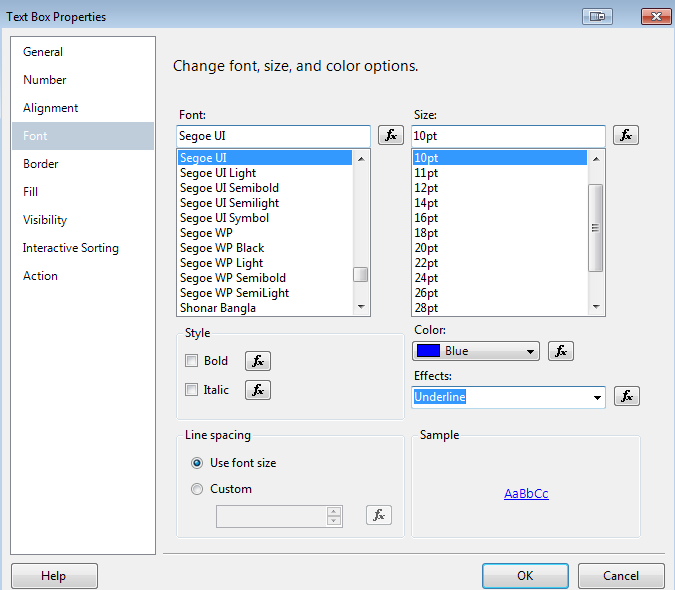
parent report > device cell > textbox properties > change font
-
switch to preview mode
select a device in the parent chart
navigate to child report
-
Previous
SQL Server Reporting Services Tutorial 2 - Visual Studio -
Next
SQL Server Reporting Services Tutorial 4 - Create charts